Map Sources
To switch to another map, open the Map Source menu in the app settings or tap the layers icon on the map view.
Use this menu to manage your list of preferred map sources and hide unused sources from the switch map menu.
Generally, there are two types of maps you can use within the app: offline and online.
Offline maps
The offline maps available in Guru Maps are vector maps generated directly on the device using OpenStreetMap data. These maps provide navigation and topographical information, are highly accurate and fast, and occupy less storage space than raster maps.
Choose from three available vector map styles:
- City: This map style is ideal for urban environments, providing clear and detailed information for navigation within cities and towns.
- Cycling: Includes additional information relevant to biking, such as bike lanes, trails, and cycling-friendly routes.
- Hiking: Offers topographical details, trails, and other features essential for hiking and outdoor adventures.
You can also use your own maps in .sqlitedb and .mbtiles formats, previously created on a computer and then imported to your device. These maps can be viewed offline even when your mobile device has no internet connection. However, personal raster/tile maps consume considerably more storage than vector maps.
Read also: Offline Maps Import.
Online maps
The online maps available in Guru Maps come from third-party providers and are delivered as raster tiles. They offer a variety of visual styles and detailed information to suit different needs.
Here is a list of the built-in raster map sources available for online use within the app:
- Atlas (Pro)
- CyclOSM
- HERE Hybrid (Pro)
- Humanitarian OSM
- Landscape (Pro)
- Mobile Atlas (Pro)
- Nighbourhood (Pro)
- OpenBusMap
- OpenCycleMap (Pro)
- OpenStreetMap
- Outdoors (Pro)
- Transport (Pro)
- Transport Dark (Pro)
- USGS - Satellite
- USGS - Satellite+
- USGS - Topo
- Wikimapia
Map download speed can vary based on your internet connection and the performance of the map provider's server.
Caching online maps
Caching is always enabled in Guru Maps. The app automatically saves recently viewed map tiles in your cache, making them accessible offline. To ensure maps are available when you're offline, follow these steps:
- Navigate to the specific area you plan to visit within Guru Maps.
- While connected to the internet, zoom-in to the required level of detail. Guru Maps saves the map tiles at the zoom levels visible on the screen, allowing you to access them offline.
For more information on configuring the online maps settings in Guru Maps, please refer to the Online Maps Settings section.
Overlays
Overlays in Guru Maps are transparent layers that display additional data on top of the base map. You can enable multiple overlays at once for a more complete picture.
Within the Guru Maps app, you have access to three primary offline map overlays for relief visualization:
- Contour Lines: Contour lines are overlaid on the map and show the elevation above sea level at a given point.
- Hillshades: The hillshade overlay adds shading and shadows to the map, simulating the effect of sunlight on the terrain. It provides a more realistic relief representation of the landscape and gives a 3D feel.
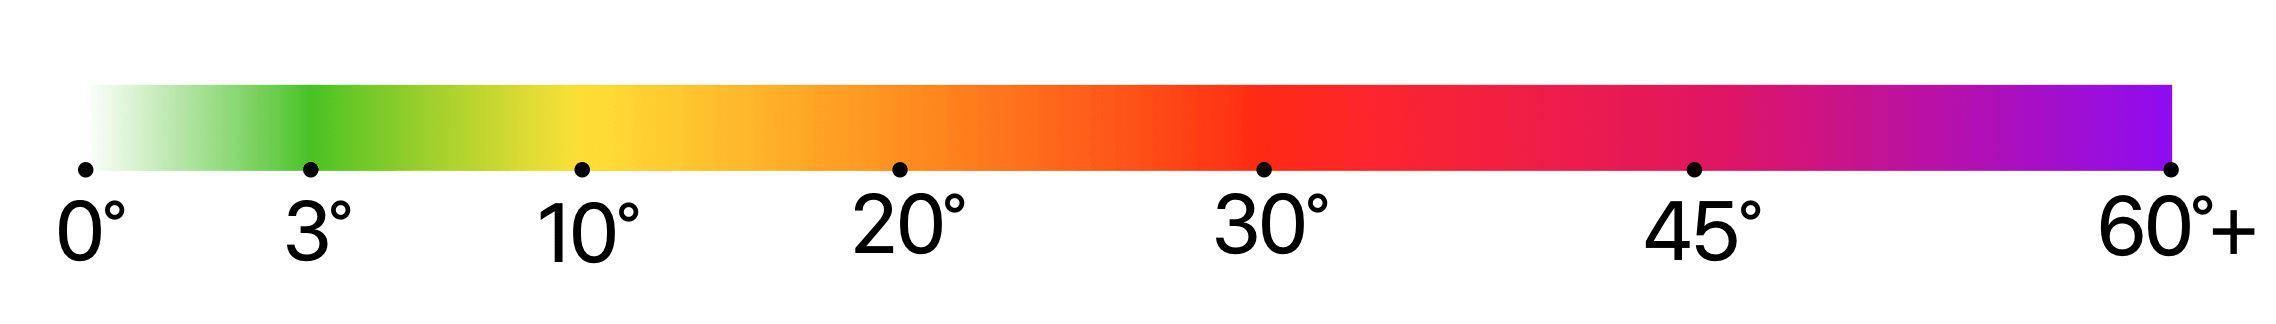
- Slopes: The slope overlay displays color-coded slope angles, helping you visualize the difficulty or potential hazards of a route. Darker colors indicate steeper slopes, making it easier to assess the terrain and plan your journey.
Online map overlays:
- OpenSeaMap: This overlay is a visualization of a free nautical database using OpenStreetMap data. It includes beacons, buoys, and other navigation aids, as well as port information, repair shops, and chandleries.
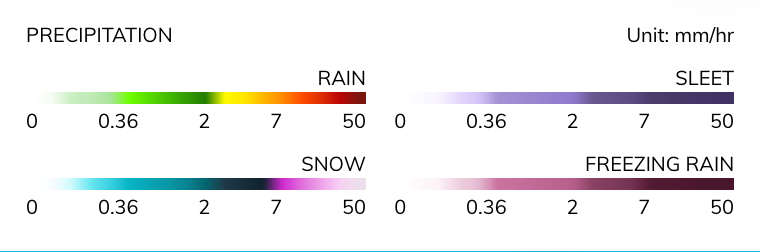
- Precipitation Intensity: This real-time weather map overlay displays the amount of precipitation falling at a given time in millimeters per hour.
Additional maps
In addition to built-in online raster maps, Guru Maps also supports custom maps and overlays.
Supported types include:
.sqlitedband.mbtilesfor offline raster maps.msand.xmlfor custom maps or extra parameters.geojsonfor vector overlays.mapcssfor custom style used for.geojson
Add more online map sources from:
To add a map source, tap the map name you want to install. Then open the downloaded .ms file with Guru Maps on your device or choose the option to send the file to Guru Maps.
To add a new map source, follow these steps:
- Visit one of the links on your device.
- Tap the map source you want to use.
- Locate the downloaded
.msfile on your device. - Open the
.msfile with the Guru Maps app or choose the option to send the file to Guru Maps if prompted.
The selected map source is now available in Guru Maps, expanding your range of online maps.
Examples of use
Online map sources
A .ms file should contain online tile URLs from the map provider. It can also include additional params for raster maps .sqlitedb, .mbtiles, or vector overlays .geojson.
For example: https://ms.gurumaps.app/ms/OpenStreetMap.ms
<?xml version="1.0" encoding="UTF-8"?>
<customMapSource>
    <name>OpenStreetMap</name>
    <url>http://{$serverpart}.tile.openstreetmap.org/{$z}/{$x}/{$y}.png</url>
    <serverParts>a b c</serverParts>
</customMapSource>
When the <url> tag is set, the map source downloads online raster tiles. The following parts are inserted into the <url> template:
{$serverpart}- random server name from<serverParts>,{$x},{$y},{$z}- tile address,{$quad}- Quad tile address,{$bbox}- Tile bounding box in SRID 3857. Typically used for WMS servers,{$invX},{$invY}- inverted coordinates.N-xandN-y, whereNis the number of tiles on the current scale.
Tile size
To change the size of the map tile on the screen, use the tileSize tag. It is measured in display points. When tileSize is unset, the default value is 256 display points.
<customMapSource>
    <tileSize>128</tileSize>
</customMapSource>
Overlay
To display the map source as an overlay, use the overlay attribute.
<customMapSource overlay="true">
</customMapSource>
Opacity
To make the overlay transparent, use the opacity tag with a value from 0.0 (completely transparent) to 1.0 (completely opaque).
<customMapSource overlay="true">
    <opacity>0.7</opacity>
</customMapSource>
Tile refresh interval
Set a tile refresh interval for a map source to refresh expired tiles automatically. Cached tiles are used during the refresh or when you are offline. The interval is measured in minutes.
<customMapSource>
    <tileRefreshInterval>60</tileRefreshInterval>
</customMapSource>
Valid zoom levels
To limit available zoom levels of a map source minZoom and maxZoom are used.
<customMapSource>
    <minZoom>4</minZoom>
    <maxZoom>12</maxZoom>
</customMapSource>
Tiles outside this zoom range are not downloaded. For overlay map sources, tiles outside the range are not displayed.
Overzoom
Use the overzoom attribute to keep displaying a map source without downloading additional tiles. When set to true, the map source remains visible below the defined zoom interval.
<customMapSource overzoom="true">
    <minZoom>4</minZoom>
    <maxZoom>12</maxZoom>
</customMapSource>
GeoJSON
GeoJSON is an open standard format designed for representing simple geographical features, along with their non-spatial attributes. More details at: https://geojson.org
{
    "type": "Feature",
    "properties": {
        "@id": "node/524678909",
        "leaf_cycle": "evergreen",
        "leaf_type": "needleleaved",
        "natural": "tree",
        "species": "Pícea",
        "species:ru": "Ель"
    },
    "geometry": {
        "type": "Point",
        "coordinates": [
            26.0211965,
            53.1146981
        ]
    },
    "id": "node/524678909"
}
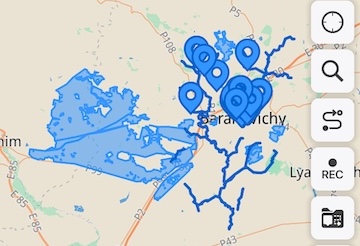
Import https://gurumaps.app/example/feature_collection.geojson to view forests, trees, and rivers near Baranovichi, Belarus. You can import any of your GeoJSON files into Guru Maps and use them as overlays on top of the base map.
By default, the following style is applied to GeoJSON:
* {
    details-text: eval(tag('name'));
    details-description: eval(any(tag('description'), tag('desc')));
}
line {
    width: 3pt;
    color: #0062CC;
    linecap: round;
}
area {
    fill-color: #3395FF88;
    width: 2pt;
    color: #3395FF;
}
node {
    icon-image: 'poi_geojson.svg';
    icon-offset-y: 0;
    image-allow-overlap: true;
}
GeoJSON + MapCSS
MapCSS is a CSS-like language for map stylesheets. It's used to define how data from GeoJSON should be displayed on the map.
Together with the feature_collection.geojson file from the previous step, import the file https://gurumaps.app/example/feature_collection.mapcss. Here is its content:
node[natural=tree] {
    icon-image: "poi_circle.svg"
    icon-tint: red;
    image-allow-overlap: true;
}
node[natural=tree][leaf_cycle=evergreen] {
    icon-tint: green;
}
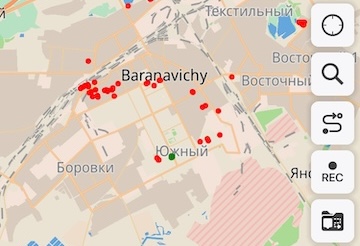
After importing, only trees remain visible on the map. Evergreen trees are marked with green circles and all other trees with red circles.
For any .geojson, you can add your own .mapcss style to customize when, how and which data should be shown. Read more in MapCSS specification.
Map Source .ms for vector data
Import the file http://gurumaps.app/example/vector_source1.ms. Here's the content:
<?xml version="1.0" encoding="UTF-8"?>
<customMapSource overlay="true">
    <name>GeoJSON from url</name>
    <geojson url="https://gurumaps.app/example/feature_collection.geojson"/>
</customMapSource>
After import, the app automatically downloads the data from https://gurumaps.app/example/feature_collection.geojson.
Consider the file http://gurumaps.app/example/vector_source2.ms.
<?xml version="1.0" encoding="UTF-8"?>
<customMapSource overlay="true">
    <name>GeoJSON with autoupdate</name>
    <geojson url="https://gurumaps.app/example/feature_collection.geojson" updateInterval="5"/>
    <style url="https://gurumaps.app/example/feature_collection.mapcss"/>
</customMapSource>
The <geojson> and <style> tags may contain a url attribute with a link to the data and an updateInterval attribute with the update check interval in minutes. They can also include inline data or a <![CDATA[ ]]> block with GeoJSON content, as in http://gurumaps.app/example/vector_source3.ms.
<?xml version="1.0" encoding="UTF-8"?>
<customMapSource overlay="true">
<name>GeoJSON and Style embed in MS</name>
<minZoom>3</minZoom>
<maxZoom>9</maxZoom>
<geojson>
{
"type": "Feature",
"properties": {},
"geometry": {
"type":"MultiPolygon",
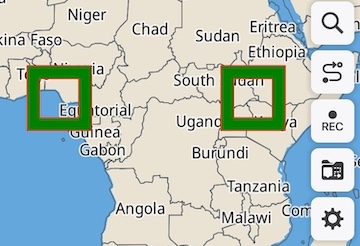
"coordinates": [[[ [0.0, 0.0], [10.0, 0.0], [10.0, 10.0], [0.0, 10.0] ],
[ [2.0, 2.0], [ 8.0, 2.0], [ 8.0, 8.0], [2.0, 8.0] ]],
[[ [30.0,0.0], [40.0, 0.0], [40.0, 10.0], [30.0,10.0] ],
[ [32.0,2.0], [38.0, 2.0], [38.0, 8.0], [32.0, 8.0] ]]]}
}
</geojson>
<style>
area{
fill-color: green;
width:1pt;
color:red;
}
line{
width:1pt;
color:yellow;
}
</style>
</customMapSource>
GeoJSON data and styles can be embedded within a .ms file and remain independent of external sources.
Raster map .sqlitedb or .mbtiles and Map Source
For raster maps you can define additional parameters in a .ms file. For example, make a map.sqlitedb raster map an overlay by adding the following content to map.ms:
<?xml version="1.0" encoding="UTF-8"?>
<customMapSource overlay="true">
</customMapSource>
Note: The .sqlitedb file and .ms file share the common name map.
In addition, you can specify the map <name>, the <minZoom> and <maxZoom> levels, and whether to use overzoom to show enlarged tiles when the user zooms in past the maximum level.
<?xml version="1.0" encoding="UTF-8"?>
<customMapSource overlay="true" overzoom="true">
    <name>Raster map with extra params</name>
    <minZoom>8</minZoom>
    <maxZoom>12</maxZoom>
</customMapSource>